Stacking Fault
Simulations – III
Introduction: Here we continue the simulation of kaolinites started in Stacking Faults-II. If you have not done this exercise and finished by saving the project file (kaolinite.gpx) please do that first as this exercise uses the results of that exercise. The data we are trying to simulated is from a less well ordered kaolinite from Washington County, Georgia (Clay Minerals Society Standard KGa-1b) collected with CuKa radiation on a Bruker instrument and thus in the Bruker RAW file format. The KGa-1b sample contains a small amount of anatase (TiO2).
If you have not done so already, start GSAS-II and open your kaolinite.gpx file.
Part 1. Create a
new phase
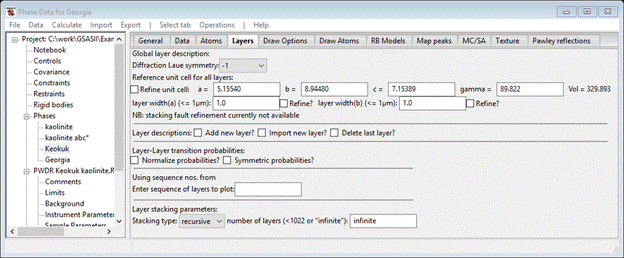
We will need a new ‘faulted’ phase for the simulation of the Georgia (KGa-1b) kaolinite pattern. Do Data/Add new phase and give it a name (I chose ‘Georgia’); the General tab will be displayed. Change the Phase type to faulted; the page will be redrawn and a new tab (Layers) will appear. Select it.

We need to enter the kaolinite abc* lattice parameters; these can be obtained from the kaolinite.gpx project file. Do Operations/Copy phase cell; a file selection dialog will appear showing kaolinite.gpx. Select it and then select kaolinite abc* from the next popup window; the Layers tab will be redrawn with the new lattice parameters.
We’ll add the layers in a moment.
Part 2. Import
powder data to simulate.
The powder data from the KGa-1b (kaolinite from Washington Cty., Georgia) is what we are going to simulate; do Import/Powder Data/from Bruker RAW file. Select KGA1-CONT.RAW; answer Yes for question about the file. We will use the internal default instrument parameters; press Cancel on the file selection dialog and select Defaults for CuKa lab data from the next popup. The next popup asks about the phases to be included.

Select Georgia which is the faulted phase created in Step 1. The pattern will be displayed.
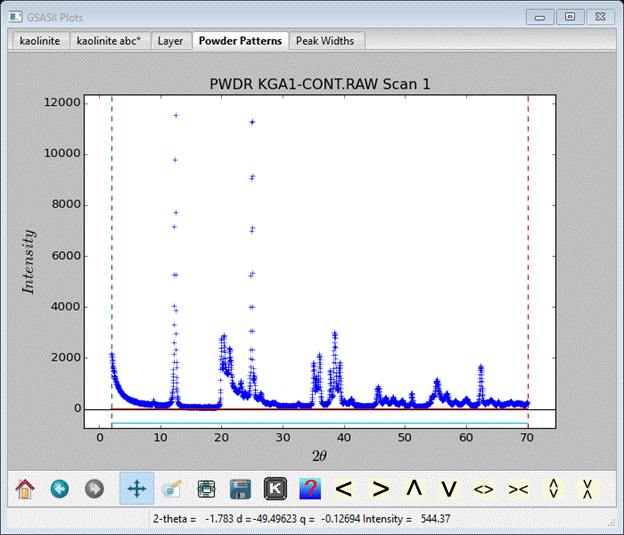
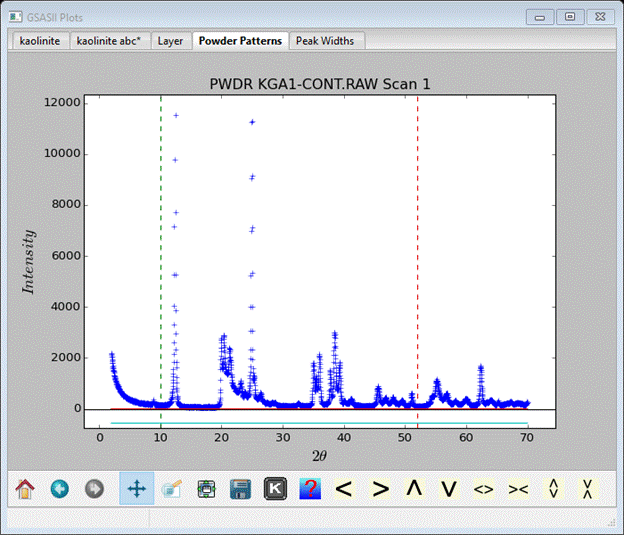
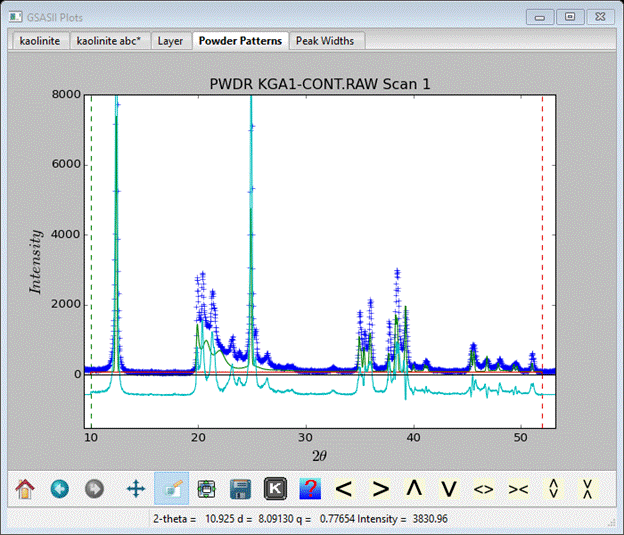
It covers 2-70° 2Θ and shows some of the obvious characteristics of stacking faults, especially the sharp rise/sloping background feature at 20-30° 2Θ. We want to limit the range for the simulation to be 10-52° 2Θ (do this in Limits under PWDR KGA1-CONT.RAW Scan 1), set the first background coefficient to something reasonable (in Background & the flat portion < 20° 2Θ = ~80). In Instrument Parameters change W to 40 and in Sample Parameters set the Histogram scale factor to 40. Also change Diffractometer type to Bragg-Brentano. The powder pattern will show the new limits.
Finally select the Georgia phase and the Data tab; it will be empty.

Do Edit Phase/Add powder histograms; a popup will show the available PWDR data sets. Select just PWDR KGA1-CONT.RAW Scan 1 and press OK. The Data tab will be redrawn; currently none of this information is of use in stacking fault simulations.
Step 3. Setup layer
model for simulation.
We now need to fill the layer data with atoms and develop a stacking fault model for the simulation. Select the Georgia phase and the Layers tab.

To begin we need a kaolinite layer; you can use Import new layer as before. Select kaolinite.gpx and pick kaolinite abc* from the list of phases; the Layers tab will be redrawn showing the atom list for the layer.

Change the Layer name to kaolinite A (the Layers tab will be redrawn).
To make a defect structure we need a second layer which will be the same as the first one; select Add new layer. The Layers tab will be redrawn again. Scroll down to find the new layer.

Change the Layer name to something other than ‘Unk’; I used ‘kaolinite B’ (the tab is redrawn). Then change the Same as to kaolinite A; that gives it the same set of atom parameters. Finally change all Dx=-.368, Dy=-.0246 and Dz=1.0; this will be the same as the triclinic Kaokuk stacking arrangement. Set the kaolinite A-A and B-B probabilities to 1.0 and the cross terms to 0.0 to reproduce the ordered stacking.
Step 4. Simulations
of Georgia kaolinite
To do the simulation do Operations/Simulate pattern and Ok for the next two popups.

The result should be nearly identical to the one we obtained for Keokuk kaolinite and it does not represent the data very well especially in the 20-30° 2Θ region. The intent of having the 2nd kaolinite layer is to displace it relative to the first one as a stacking fault. The literature has many such models suggested (e.g. see G. Artioli, et al. Clays & Clay Min., 43, 438-445, 1995); a simple one is to displace the 2nd layer by b/3 which places the SiO4 layer in the same alignment with the previous AlO6 layer but with effectively a different orientation than for a pair of Keokuk layers. Compare the Keokuk stacking (A-A; I pressed the L & F keys to get labels & fade the 2nd layer).
With the kaolinite A-B Dy=1/3-0.0246=0.3087.
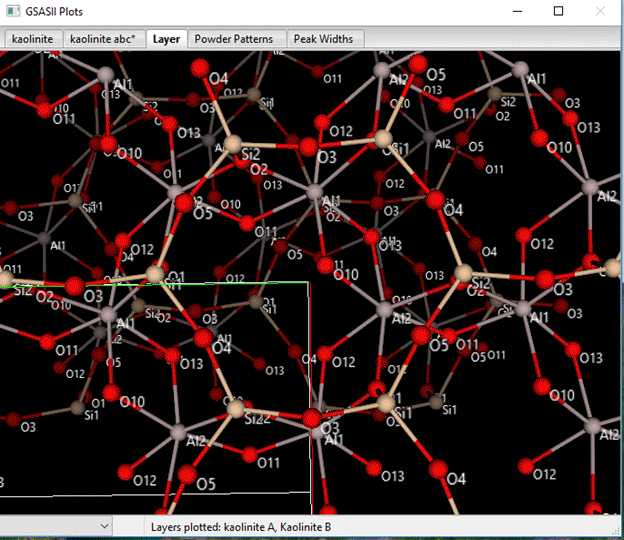
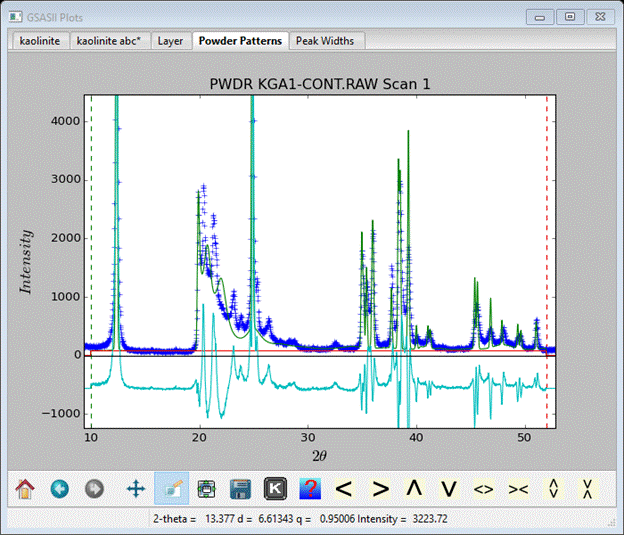
If you carefully compare these two drawings, you can see that the orientation of the 2nd (faded) layer with the 1st layer is the virtually same for both but in different directions. You should check that the kaolinite B-A and B-B stacking shows the same relationship (change kaolinite B-A Dy=0.3087). Next, change all the probabilities to 0.5 and rerun the simulation.
The 20-30° 2Θ region is not well reproduced; the features are in the wrong place and are too broad. There is probably too much disorder in this model. The Histogram scale factor is also too low; evidently this data set was collected with at least twice the step time as the Keokuk one. Go change it to 80 and rerun the simulation. I’ve expanded the 20-30° 2Θ region to see the fit.
You can use trial & error adjusting the probabilities to find a better model. One with kaolinite A-A and kaolinite B-B probability of 0.8 and the cross terms at 0.2 gives a reasonable simulation.
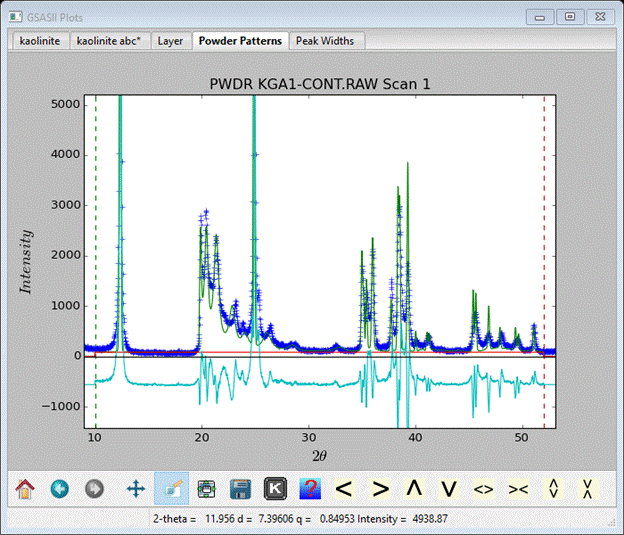
The background feature in the 20-30° 2Θ is reasonably well represented with the peaks correctly positioned and with the right intensity. One can create more elaborate models using additional stacking layers; see the paper by G. Artioli noted above for some choices. This completes the stacking fault simulation exercises; save your project file.